
ITISeasy Management Overview
Transform Business Data into Real Insights
With ITISeasy.business, empower your leadership team to make smart, data-driven decisions through fully configurable management dashboards. Visualize key metrics, KPIs, and real-time data from across your ERP—all in one place.

ITISeasy Management
Overview
Transform Business Data
into Real Insights
With ITISeasy.business, empower your leadership team to make smart, data-driven decisions through fully configurable management dashboards. Visualize key metrics, KPIs, and real-time data from across your ERP—all in one place.
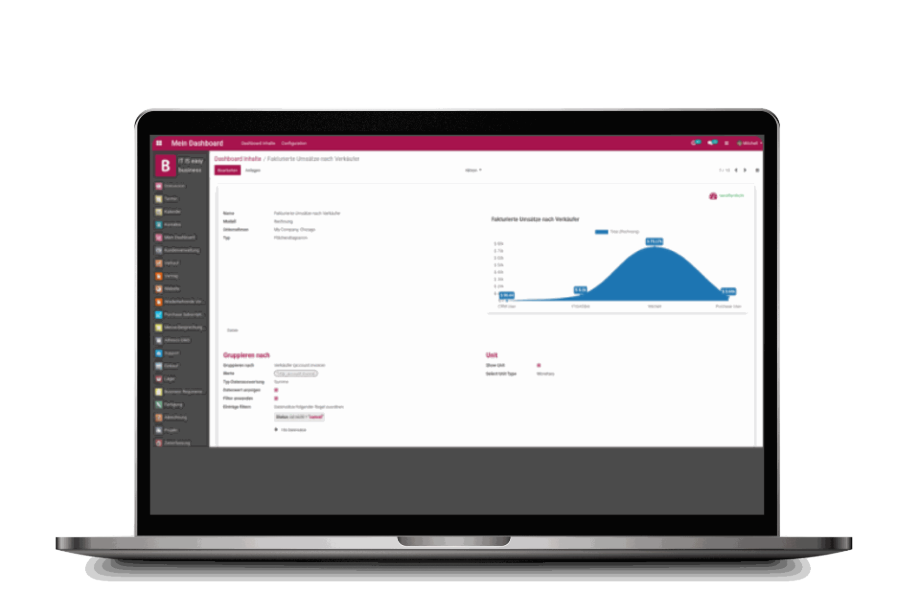
Create Custom Dashboards with Ease
Build meaningful overviews using any model and field from your ERP system. From sales and finance to
HR and inventory, tailor your dashboard to show exactly what matters most for your business.
Define your own metrics
Combine multiple data sources
Display operational and strategic insights in one view
Save time with pre-defined templates

Role-Based Data Access for Sensitive Data
Sensitive information remains protected with user-based permissions. Only authorized users can view and
interact with specific dashboards—ensuring complete data security and compliance.
Data access that aligns with your organizational structure
Role-Based Access for Sensitive Data
Sensitive information remains protected with user-based permissions. Only authorized users can view and
interact with specific dashboards—ensuring complete data security and compliance.
Data access that aligns with your organizational structure
Visualize Trends & Performance
Turn numbers into actionable insights with intuitive data visualization options:
Bar Charts – Perfect for performance comparisons
Pie Charts – Great for share or distribution analysis
Line Graphs – Spot trends and patterns over time
Custom Widgets – Design your own visual KPIs

Business Intelligence at a Glance
Whether it’s revenue growth, employee productivity, or project progress
—your dashboard becomes your business command center.
Monitor real-time metrics across:
Business Intelligence at a Glance
Whether it’s revenue growth, employee productivity, or project progress
—your dashboard becomes your business command center.
Monitor real-time metrics across:

Sales

Finance

Operations

Sales

Finance

Operations

HR

Customer Support

Projects

HR

Customer Support

Projects
Always Up-to-Date
Your dashboards automatically reflect the latest data from your ERP system. No manual updates, no spreadsheets—just real-time business insights on demand.


Always Up-to-Date
Your dashboards automatically reflect the latest data from your ERP system. No manual updates, no spreadsheets—just insights on demand.
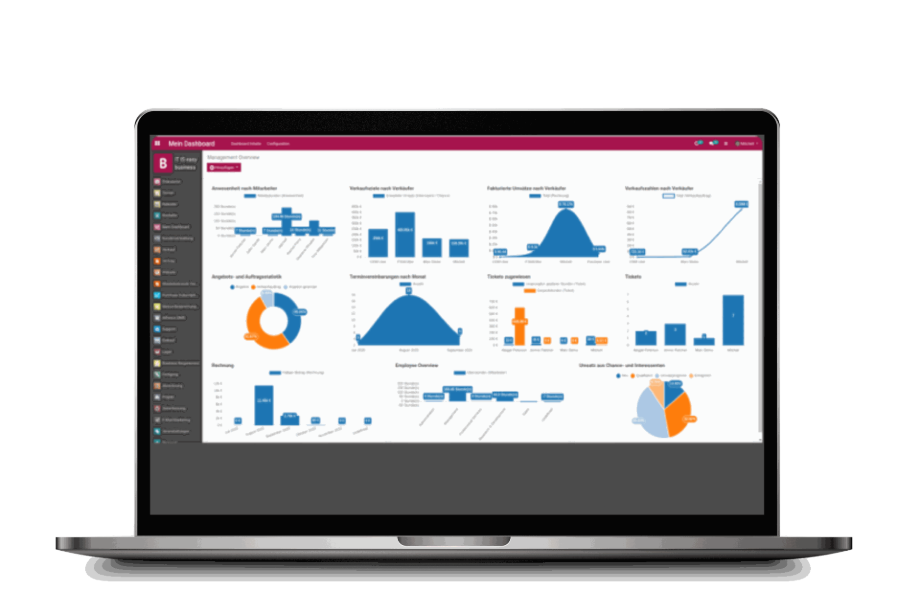
Generic Management Dashboard
Use our pre-built generic dashboards or customize them to your company’s needs. Highlight key business areas and empower your managers with crystal-clear visibility.
ITISeasy.business turns complex ERP data into simple, strategic decisions.
Generic Management Dashboard
Use our pre-built generic dashboards or customize them to your company’s needs. Highlight key business areas and empower your managers with crystal-clear visibility.
ITISeasy.business turns complex ERP data into simple, strategic decisions.

Ready to Get Started?
ITISeasy.business is more than ERP—it's your strategic partner for business intelligence.
Contact us for a demo and see how your business can benefit from powerful dashboards!
Ready to Get Started?
ITISeasy.business is more than ERP—it's your strategic partner for business intelligence.
Contact us for a demo and see how your business can benefit from powerful dashboards!